The stats behind the season
From a professional football data analyst and Argyle fan
It’s international break, so we’ve turned this week’s One Team In Devon over to a unique Argyle fan.
Alberto Lauciello is an Argyle supporter based in Milan. But he’s also a Football Data Analyst consultant for Eurosport Italy. You can find him on Twitter (X) here.
Alberto spent the summer of 2010 in Plymouth learning English and fell in love with the city.
“I was already a football fan. My favourite colour is green. 1+1=2 and I fell in love with Argyle as well.”
“I started following in those bad times from home thanks to the radio. This year have been to Wembley for the Papa John’s final. Despite the result was still a good environment”
As a data analyst, Alberto has pulled the numbers on Argyle and picked out five interesting points from the season so far.
COYG
Big shooters
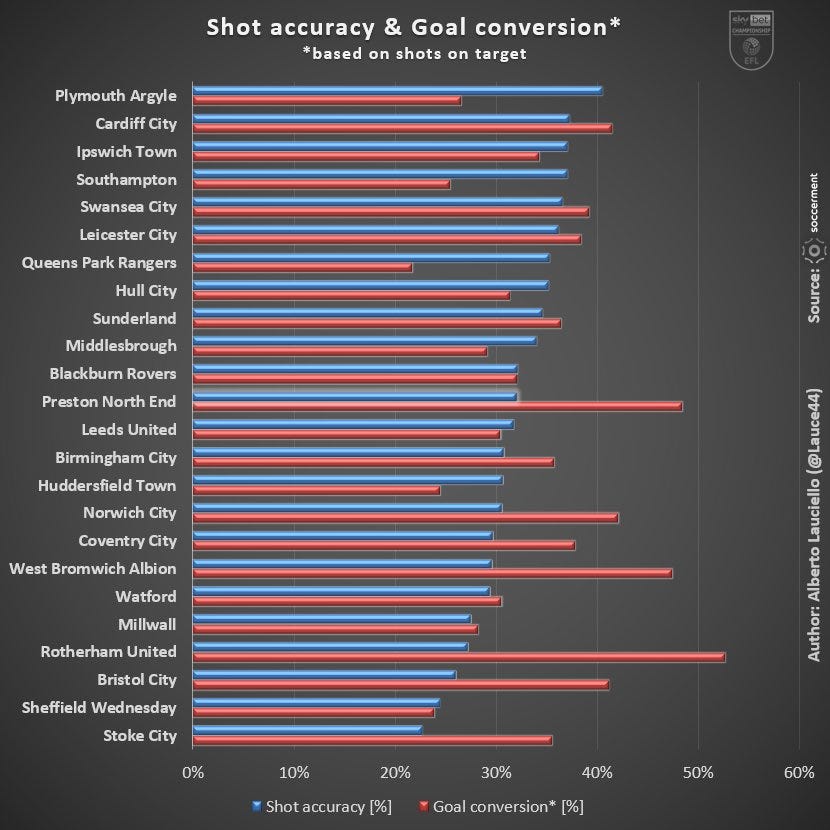
Argyle have the best shot accuracy in the league, but their goal conversion rate is the 20th worst. This suggests that they are facing in-form keepers, but also that their shots are not particularly dangerous. They are 18th in the league for post-shot xG per shot, a measure of average shot on target danger.
We concede lots of dangerous chances
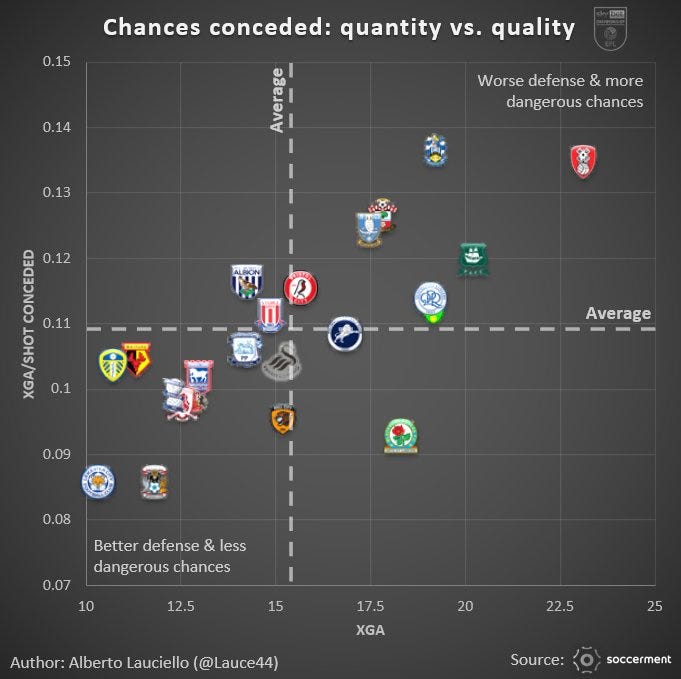
Argyle have one of the worst defences in the league, both in terms of the number of chances they concede (23rd) and the average danger of those chances (20th).
The x-axis (xGA) shows the expected goals against, but the y-axis shows the quality of these chances. The closer you are to the top-right-hand corner, the worse our defence is.
It’s notable that Sheffield Wednesday have a lower xG against than Argyle – a worrying sign, and supports those who are calling for Argyle to tighten up at the back. However, the graph doesn’t allow for the quality of opposition faced.
Dribble-tactic Argyle
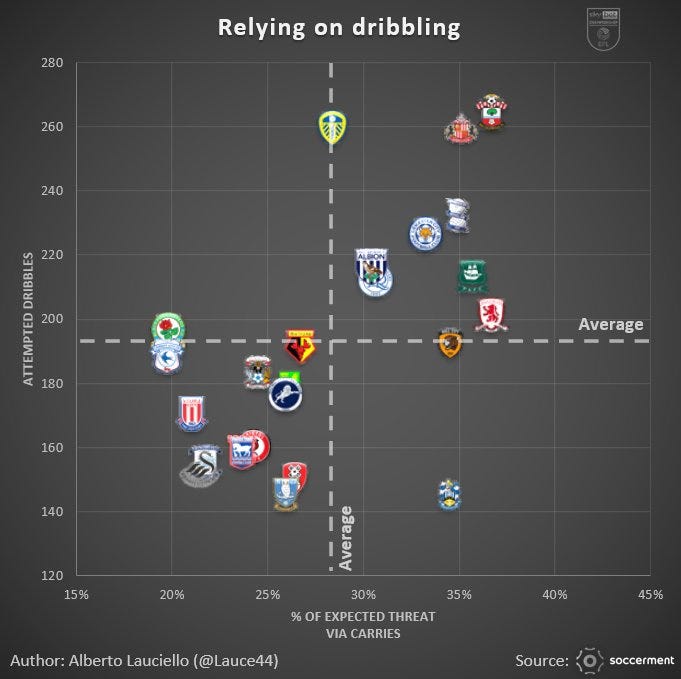
Argyle rely heavily on dribbling to advance the field and create threats – little surprise when so much play goes through Mumba and Whittaker. They are seventh in the league for attempted dribbles and third for percentage of expected threat via carries.
Expected threat is a measure of how dangerous a team's possession is at a given point on the pitch. It is calculated by taking into account the location of the ball, the number of defenders nearby, and the quality of the shot that is likely to be taken from that position.
When a team moves the ball from a less dangerous area of the pitch to a more dangerous area, they have a positive expected threat. This can be done through either passing or carrying the ball. Teams typically use passes to move the ball up the pitch, but they vary in how much they rely on carries.
Argyle's high ranking in expected threat via carries suggests that they are effective at using dribbling to create dangerous goal-scoring opportunities.
Of course, other teams will be aware of this data, and it perhaps shows where Millwall were particularly effective in nullifying Argyle’s threat.
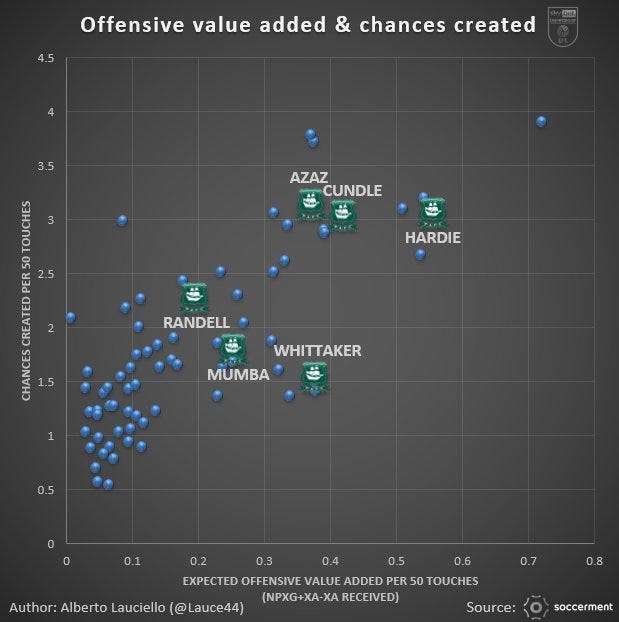
Talking about dribbling, this shows how Whittaker and Mumba stack up in the league.
Both are amongst the top player in the league for carrying the ball – and the expected threat when they have the ball at their feet.
Per 50 touches is a method of normalization that compares football statistics based on the number of times a player touches the ball. It is a more accurate way to compare players than per 90-minute normalization because it takes into account the fact that players touch the ball at different rates. This is important because some players touch the ball more than others, and this can affect their statistics. For example, a player who touches the ball more is more likely to have more dribbles, passes, and shots.
Hazard is a top performer in the league
Conor Hazard is preventing more goals than expected, despite facing very difficult shots on goal.
This is based on post-shot xG, which is a measure of expected goals that take into account the location of the shot in the goal, the speed of the ball, and the position of the goalkeeper.
It is still a relatively new metric, but it can give us a general idea of how well a goalkeeper is performing. Hazard himself was better in the early games of the season, but he has still saved more goals than expected overall.
The percentage of post-shot xG saved is calculated by subtracting the number of goals conceded from the post-shot xG faced, and then dividing by the post-shot xG faced.
This gives us a percentage that represents how much better or worse a goalkeeper is performing than an average keeper. Hazard's current percentage puts him in the top percentage of keepers in the league.
The criticism often leveled at Hazard is distribution. A study of his passing and distribution metrics showed nothing untoward, and his passing accuracy was average (or slightly below average) for Championship goalkeepers.
Dangerous players
xOVA, or expected offensive value added, is a metric that measures a player's offensive impact on the team. It is calculated by taking the player's non-penalty expected goals (xG) and adding their expected assists (xA), but then subtracting the expected assists they receive (xA received).
This means that xOVA takes into account both a player's goal-scoring ability and their ability to create chances for their teammates. It also takes into account the fact that some players are in positions where they are more likely to receive assists, such as strikers.
xOVA is a relatively new metric, but it has quickly become one of the most popular ways to measure a player's offensive impact. It is used by analysts and coaches all over the world to identify the most effective attacking players in the game.
It shows that Azaz and Cundle create the most chances per 50 touches, and Randell is also well up there in terms of creativity. Hardie is also an outlier in the league for his chances created and expected value added.
This is likely an effect of the 4-3-3 that leaves Whittaker in particular cutting in from the left, while Azaz and Cundle get closer to the box in terms of the midfield three.
However, Whittaker is still a top performer in terms of added offensive value.


In other words, we’re loose and lightweight! My criticism since the opening matches of the season. We will get more joy against open, free playing sides (Norwich) than tight, organised sides (Millwall). We need to start converting chances because we often concede, WBA excepted! 😁💚